Child BMI
The calculation of the body mass index functions generally the same for kids as it does for adults. Only the meaning of the evaluation changes..Child BMI Calculator
A research team (K. Kromeyer-Hauschild, M. Wabitsch, D. Kunze et al.) Published studies in 2001, where a large portion of girls and boys were weighed. From this came diagrams with the distribution of the body mass index based on age.
In the diagram, the top calculated value is displayed as a dark red line. This way you can easily see where your child's BMI lies.
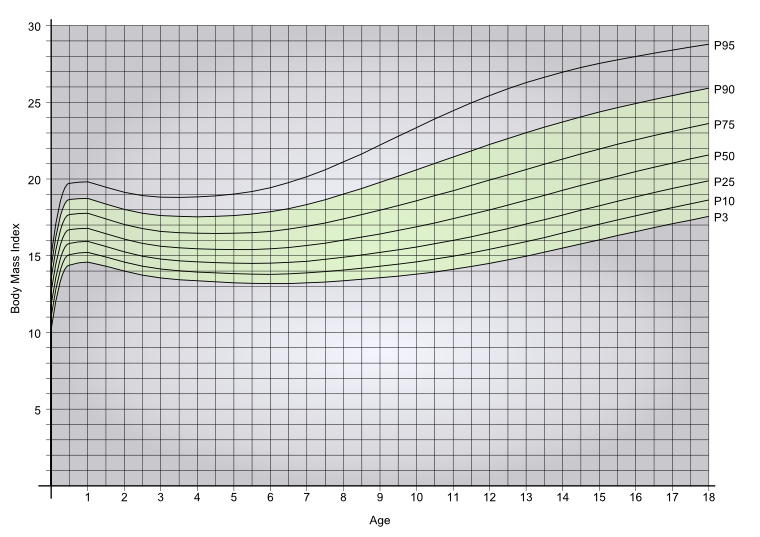
Boys BMI

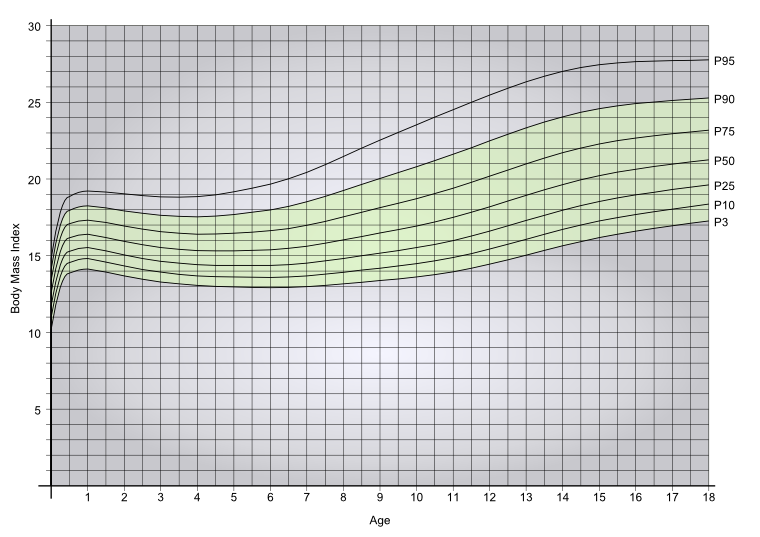
Girls BMI

You see the so-called percentile curves in the diagrams. These indicate the distribution. P50 means, for example, that 50% of children have a higher BMI and 50% have a lower BMI. P3 means that 3% of kids have a lower BMI.
Overweight is defined at P90. So the 10% of kids with the highest BMI are considered overweight. Underweight is defined under P3. So the 3% of kids with the lowest BMI are considered underweight. In the above tables, both these areas are displayed gray and the normal weight area between them is green. Why these percents were chosen is however unclear. Presumably because the values go well with those who created the WHO BMI Table that work for adults. It deals with a statistical attribution as a medical assessment. Since the body mass index is highly imprecise, this is no longer relevant.
Especially for small children, this classification can be seen as very critical. A small growth spurt can cause the BMI to sink drastically. A child should not be put on a diet just because the body mass index is too high. In any case, speak with a doctor before hand.